Overview of MacNMR Software
The Tecmag data system used for operation of the QE 300 uses MacNMR to control data acquisistion and processing. This document is intended to be an overview of the software program.
Open the Software
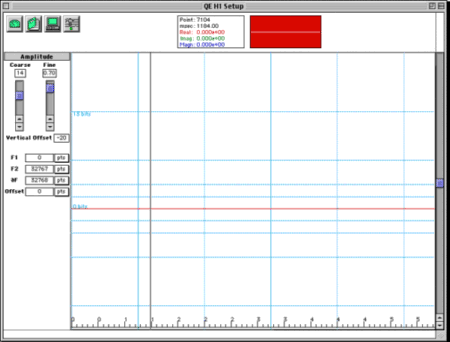
After the MacNMR software loads, select a user file to specify the instrument parameters and initial settings. The opening screen looks like the figure below.
The menu buttons at the top left include:
 Dashboard. This shows the primary instrument settings in use.
 Comments
 Control Panel. This opens the instrument control windows.
 Pulse Program. This opens the pulse programing window.
Dashboard
The dashboard window is shown below. The features that can be adjusted here include:
- Scans 1D - The number of spectra acquired. Should be a multiple of 4 for phase cycling.
- SW - The spectral window
- Points - The number of data points acquired. Software rounds down to the next value of 2n.
- PW01 - The pulse width.
- Last Delay - The recycle delay between acquisitions.

Control Panel
There are three primary control panels for the instrument. You can toggle between them using the following buttons.
 Lock - Controls deuterium solvent lock
 Shim - Controls the shim settings
 Frequency - Controls the acquistion frequency, decoupling, sample loading, spinning.
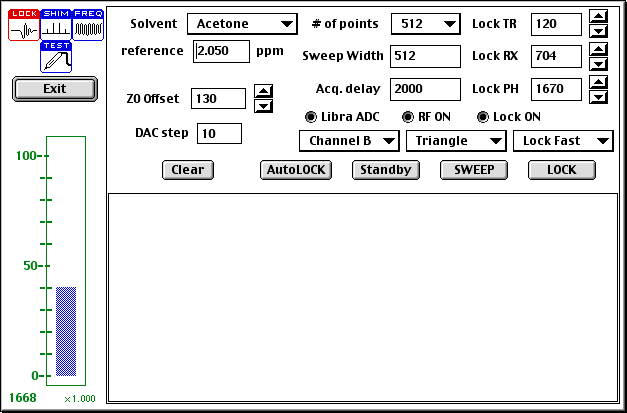
Lock
The lock control panel, shown below, is used to:
- Set the lock solvent
- Set the lock transmitter power
- Set the lock transmitter offset
- Turn the lock on
- Turn the lock to standby
- Run the autolock
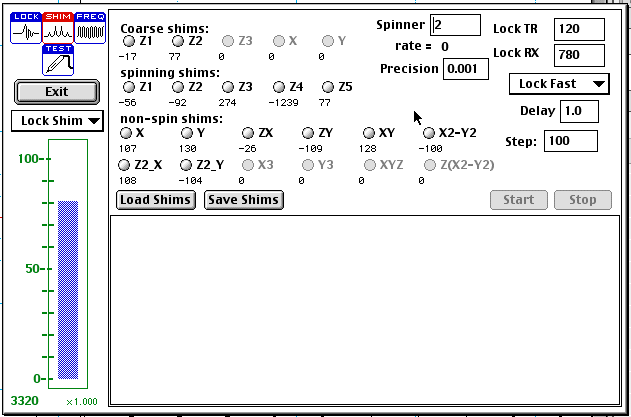
Shim
The shim control panel, shown below, is used to:
- Load shim settings
- Save shim settings
- Optimize the shims (typically spinning Z1, Z2, and Z3)
- Control the spinner
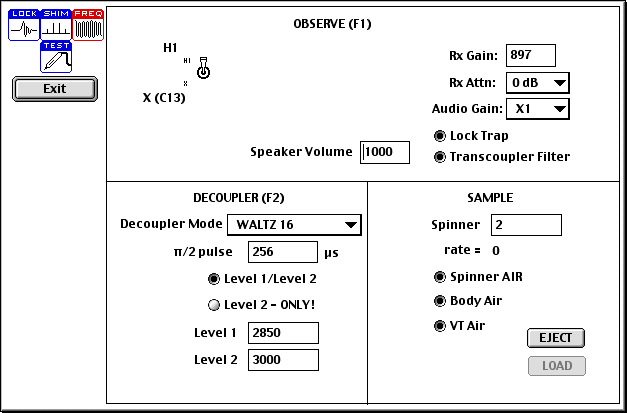
Frequency
The frequency control panel, shown below, is used to:
- Eject the sample
- Load the sample
- Set the proton decoupler
- Reciever settings
- Observation frequency (don't adjust here)
Pulse Program
The pulse program window, shown below, includes the following buttons.
- Dashboard. This shows the primary instrument settings in use.
- Comments for the pulse program.
 Toggle Pulse Sequence Display between graphical and text.
 Pulse Acquisition Settings, detailed below.
 Return to Setup Window to display FID and spectra.
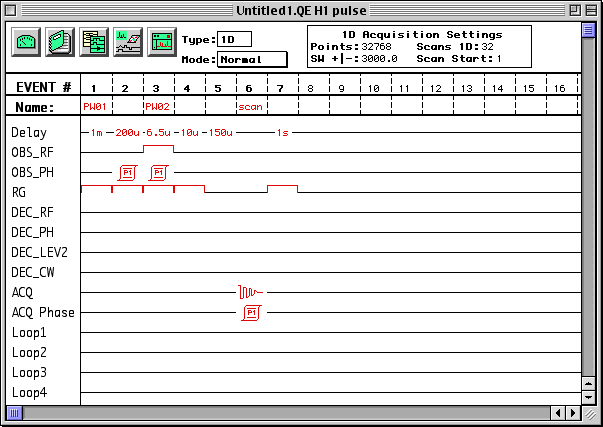
Pulse Acquisition Settings
The pulse acquisition settings window, shown below, is used to turn on 2D acquisition and set parameters for 2D experiments.

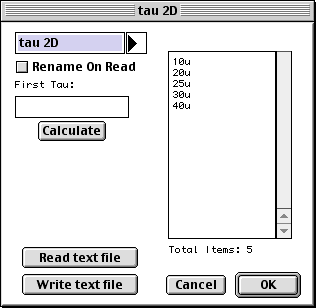
Pulse Tables
To edit a pulse table hold the "option" key and click on the table. This will open the following window that is used to edit the table. In this window you may open default tables saved for different experiments. Table T1 is reserved for 1d experiments, Table T2 for 2d, etc.
Main Menu
In the main menu, shown below,
 The script button
  is used to access programming scripts for AutoPhase and AutoGain.
Acquistion
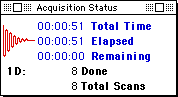
The 1D data acquisition box appears as:
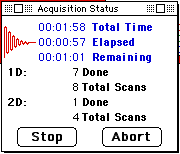
The 2D data acquisition box appears as:
Processing
For processing 2D data files that are sequential 1D experiments like the T1 Inversion Recovery or Pi pulse experiments, select the commands and then hold down the option key to select "1DFT". The following window will open.

This page is maintained by
Scott Van Bramer
Department of Chemistry
Widener University
Chester, PA 19013
Please send any comments, corrections, or suggestions to
svanbram@science.widener.edu.
This page has been accessed
times since 5/30/97.
Last Updated Tuesday, January 22, 2002 2:38:52 PM