T1 Inversion Recovery
This experiment was developed by S.E. Van Bramer for Chemistry 465 at Widener University.
Introduction:
This experimental procedure is for finding the T1 relaxation constant of an NMR sample. This constant is used to optimize many NMR experiments where it is important to avoid saturating the sample during a pulse sequence. The experimental details outlined here are in addition to the basic steps outlined in "NMR Operations for QE 300 with Tecmag Data System" and Overview of MacNMR Software. These documents explain the operational basics of the instrument.
Experimental:
Safety
- DO NOT ENTER KB 421 if you have a pacemaker or other metal implant.
- DO NOT place any magnetic material near the magnet.
- DO NOT drop small metal material in the room.
- DO NOT bring large metal objects into KB 421.
- Credit Cards, Computer Diskettes, and ATM cards can be erased inside the yellow warning
rope.
- DO NOT work unsupervised
- Follow Directions and Ask questions. The NMR costs about $150,000, be careful
- Sign-in the logbook
Sample Preparation
Load Sample
Acquire a proton spectrum using QE300 H1 Setup (note gain setting)
Acquire a carbon spectrum using QE300 C13 Setup (note gain setting)
Determine Pi and Pi/2 Pulse Width
- Open PIPULSE C13 Setup
- Open the Pulse Editor Window with the
 button
- Edit the T2 table "option" + "T2 Table"
- In the dashboard set the last delay, the gain and the number of scans.
- Zero and Go
- File Open
- Process First Slice (Use slider to select slice)
- Close and Reopen File
- Process all files "Command" "Option" + 1DFT
- Use slider to select slices
- Refine T2 table and repeat to find pi or 2pi pulse (ca 55 us).
Run T1 Inversion Recovery Experiment
- Load TIIR H1 Setup
- Set pi/2 pulse
- Set pi pulse
- Set last delay to 5*T1
- Set the gain
- Open the Pulse Editor Window with the
 button
- Edit the T2 table "option" + "T2 Table" with delays for experiment.
- For first experiment use long delay to set phase
- Find approximate T1 by adjusting tau (T2 table) to find null point.
- If peak is positive, decrease D1.
- If peak is negative, increase D1.
- NOTE: Autophase always produces positive peaks. Use autophase for the first spectrum with long delay since you expect this spectrum to be positive. Use same phase settings for subsequent spectra.
- At null point tau = ln(0.5) T1
- After approximate T1 is found
- create a table of values from 10us to 3*T1
- Set last delay to 5*T1
- Increase number of scans for required S/N
- Zero and Go
- File Open
- Process First Slice (Use slider to select slice)
- Close and Reopen File
- Process all files "Command" "Option" + 1DFT
- Use slider to select slices
- Refine T2 table and repeat.
Screen Shots For T1 Experiment
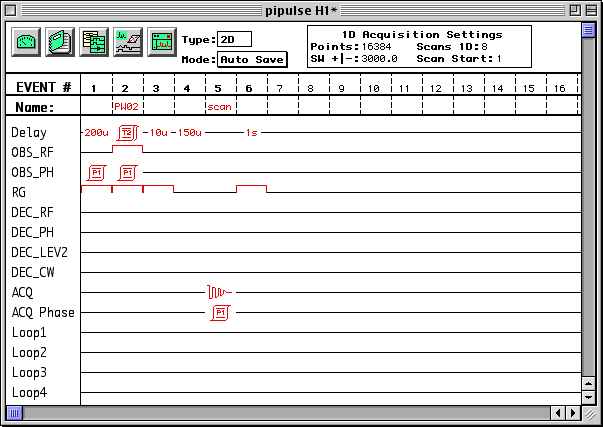
Pulse editor window for pi pulse experiment

Dashboard window for pi pulse

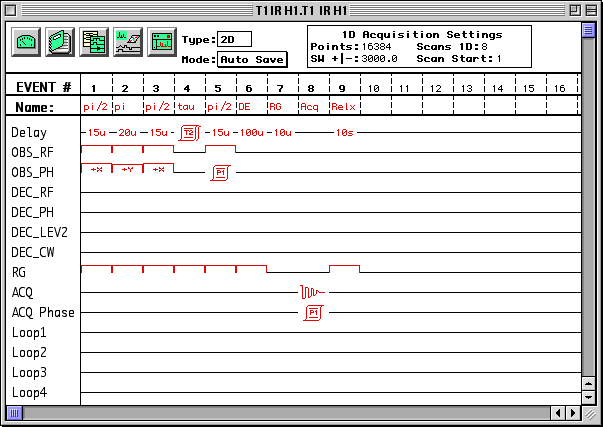
Pulse editor window for T1IR experiment

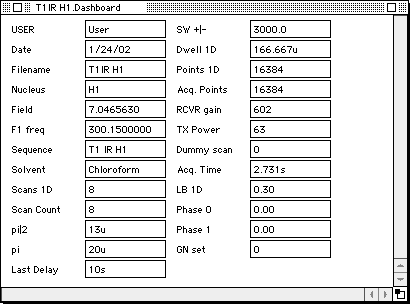
Dashboard window for T1IR experiment

Process the sequence Data
Calculate T1 using MacNMR
See pages 5-21 through 5-23 of the MacNMR manual.
Calculate T1 using Nuts
See the NUTS help file or web site for information about processing T1data. This processing may be automated with NUTS. The basic process is outlined below.
- Transfer the data to a PC.
- Retrieve the slice with the longest D1 value. [SL] number
- Switch Real and Imaginary Spectra [RI]
- Baseline correct the FID. [BC]
- Optional Processing of FID.
- Zero Fill. [ZF]
- Exponential Multiplication. [EM]
- Transform the FID. [FT]
- Phase the first spectrum (longest D1), use autophase [AP]
- Reopen the data file and process all slices using the previous phase settings.
- Setup a linked list to process the data and save as a new 2D data file. The link should be:
GA RI BC EM FT PS SC IN
- View the 2D data file
- Load the 2D data file [GA]
- Set the scale [SS]
- Stacked Plot [SP]
- Integrate the data.
- Go to the last slice, [SL]
- Switch to Integration Display [ID]
- Create a subintegral for the peak of interest. <double click>, <move>, <click>
- Set the integral value to 1. <click on subintegral>, <v>, <1>
- Go through each slice and record value of subintegral
- The Nuts help file has additional processing information.
Analysis of T1 Inversion Recovery Data.
- A graph of ln(100/(100-percent recovery)) vs delay (D1) will have a slope of 1/T1. (Note: peak area must be offset to avoid taking the log of a negative number.)
- A graph of peak area vs delay will cross the X-Axis at the half life (t½) for T1 . This is the point when the signal is null because the inversion has recovered halfway from -Z to +Z.

This page is maintained by
Scott Van Bramer
Department of Chemistry
Widener University
Chester, PA 19013
Please send any comments, corrections, or suggestions to
svanbram@science.widener.edu.
This page has been accessed
times since 1/5 /96 .
Last Updated August 28, 2007 10:36:21 AM


