Tools for Processing and Interpreting Spectral Data
Fall 2004 ConfChem Teaching Computing in Chemistry Courses
September 17 - October 22, 2004
Scott Van Bramer
Department of Chemistry
Widener University
Chester PA 1901
svanbram@science.widener.edu
Abstract
Undergraduate students acquire spectroscopic data using a wide range of instrumentation. But what do the students do with this data? If they just print out a spectrum, then the instrument software is probably sufficient. If they need to interpret the data, examine it closely, or learn about data processing they will need additional tools. This paper provides an overview of software tools for off-line data processing and interpretation of spectroscopic data.
Introduction
Most chemical instrumentation is run by computers connected to the internet and accessible from anywhere in the world. But, how do most of our students use these instruments. How often do they just collect their data and walk away from the instrument with a printed spectrum? From their perspective is this any different than plotting the spectrum on a chart recorder? Can we change the way they use instrumentation to take advantage of computer data acquisition?
This paper is written to start a discussion about the difference between how we could use spectroscopy and how we do use spectroscopy. I hope that people who are doing things differently will offer ideas and that we can identify the barriers that keep us from using the full teaching potential of modern instrumentation and software?
My vision for how this could work is that a student sits down at the instrument console during lab and acquires data. Then when they go to write their lab report they can access the raw data, process the data, view the spectra, and use software tools to help interpret the spectra. When they process the data they can change parameters to pull out the information they need. When they view the spectra they can overlay different plots, zoom in on regions, and identify peaks. When they interpret the spectra they can highlight regions, access databases, and use structure drawing software. Finally they put this information into a well written and clearly organized laboratory report.
So, what gets in the way of this vision?
- The data. How do you get the data from the instrument to the student when they are writing their lab report. The most effective way I have found is to have the computer running the instrument also setup as a Web or FTP server. With the availability of course management software, data files could also be uploaded to the class documents directory. Either of these options will allows students to access the data from any location.
- The software. I find this to be the more difficult challenge. Students use one program to acquire the data, but licensing restrictions and other problems usually make it impossible for students to use the same software outside of the laboratory. How do you get software to the students so they can write their lab report on their own computer? The best solution that I have found this is to have them use freeware that I can distribute on a CD-ROM at the beginning of the semester.
Below are some of the tools that I have found for teaching spectroscopy. I hope that some of them may be useful for your students. The information below is based upon my experience using the different software packages. Because vendors are constantly releasing updates, what I show is based upon the version of the software that I have access to at this time. Because prices are constantly changing on commercial software, check with the vendors for details. I am sure that there are lots of other good software packages out there, I look forward to hearing about others during the discussion of this paper.
The final point I would like to make in this introduction is spend time thinking about what you want your students to learn. If your goals and objectives are clear, you can find the tools. If your goals and objectives are not clear, you will confuse what you want students to learn with how they can learn. There are tools now available for interpreting spectra that can completely change the way we look at data. How do we want students to use these tools? Also be careful that what you choose has value for your students. I find my students are very pragmatic. A program that I think is incredible, will fall flat if it is not useful for the students.
When purchasing an instrument, I encourage you to get liberal licensing terms from the vendor. If you purchase the software separately, it is usually very expensive and the license agreement is very restrictive. However, many vendors will include additional software licenses for standalone data processing at the time of purchase if you ask. If this is not an option, there are a number of different after market programs for viewing and processing spectral data.
Viewing Data
If you simply want students to be able to view spectral data on a computer, there are several different options. The choice that is right for your situation depends upon how much you want students to be able to do with the data, the file format for the data, how students are going to access the data, and software licensing available. It is ideal, for students to use the same software to collect and process their data. Unfortunately licensing and software compatibility often make this impossible. There are, however, several free spectral viewers that may suit your needs.
One of the most difficult parts about viewing spectral data is the large number of different file formats. Almost every vendor has a different file format for each spectroscopic technique. Often these file formats have evolved and changed as new features are added to their instrumentation. The resulting confusion makes word processing and spreadsheet file differences look trivial. JCAMP-DX is a data file format that was developed by the Joint Committee on Atomic and Molecular Physical Data (JCAMP) for the exchange of spectral data. Many instruments can save data in this file format and several free programs are available to read JCAMP-DX files. If you can save spectral data in this format, then students can then easily view their spectra using one of these programs.
|
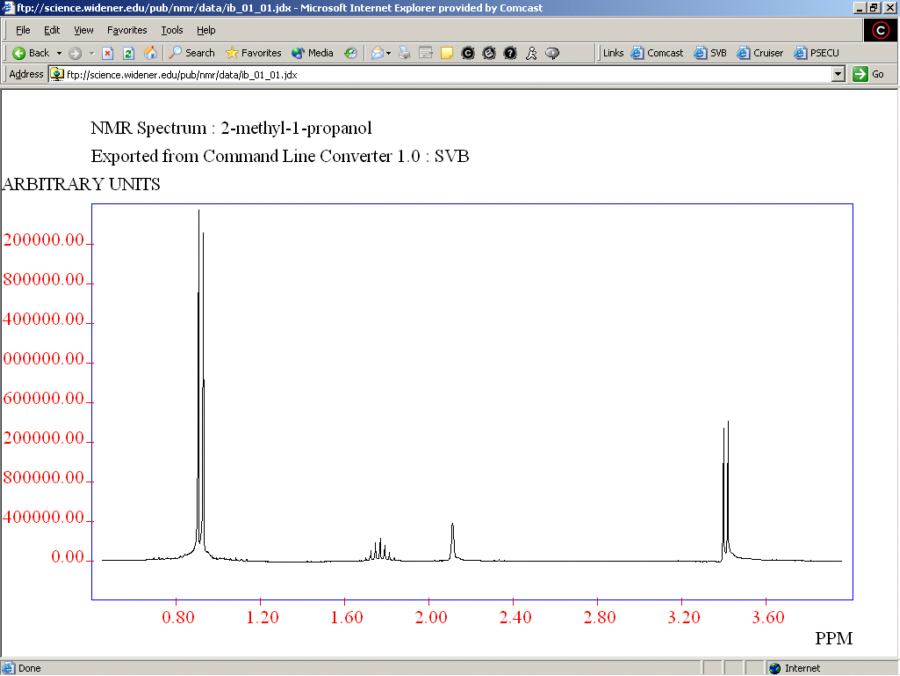
This is a plug-in application that is an easy way for students to view their spectra using a web browser. Students can register with MDLI and then download the free browser plug-in. After they have installed the software, they can view jcamp-dx spectral files in their web browser. If the computer that is used for data acquisition is also running a web server, students can access the data directly from the instrument. In the web browser they can zoom and select peaks. Getting the web browser to properly open data files may require configuring the MIME file types on the web server and there are some compatibility issues with different web browsers. When CHIME is used to display jcamp-dx spectral files, it cal interact with a molecular structure also displayed in CHIME. IR interpretation of accent by Robert Lancashire is a nice example of how this feature could be used for teaching. Spectra displayed using CHIME do not print, but if you can get the students data onto a web server, this is any easy way for them to view their spectra.
|
|
|
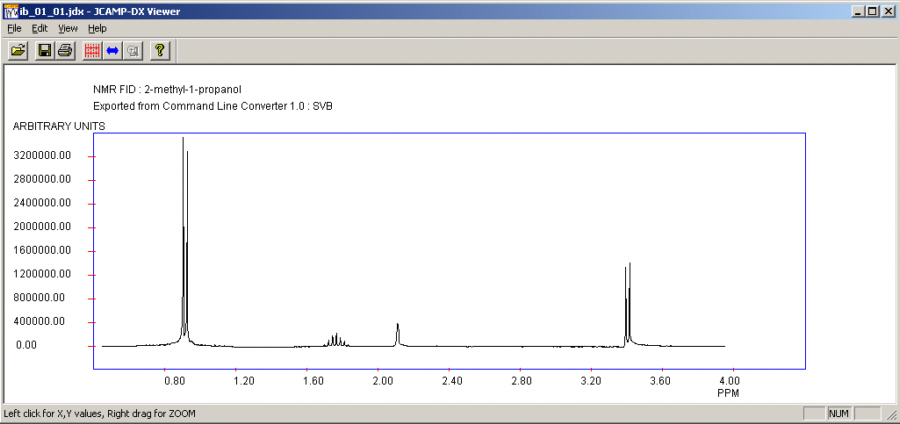
This is a free stand alone program developed by Robert Lancashire to view jcamp-dx spectra. It will open files, zoom, select peaks, and print. The advantage of this program over the CHIME plug-in is that it allows printing. This is a very small (it fits on a floppy disk) and easy to use program. Students can put their data and the program on a floppy disk.
|
|
|
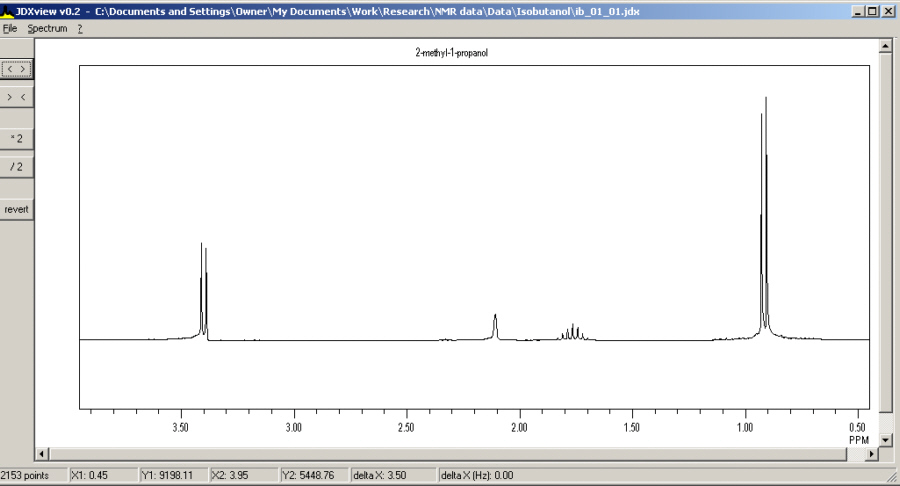
This is a free stand alone program developed by Norbert Haider. It is very similar to JCAMP-DX Viewer. It is easier to use for picking peaks and determining their intensity. Instead of printing through windows, this program creates a printer file. Although this can provide higher quality plots, most students will have difficulty using this feature.
|
|
|
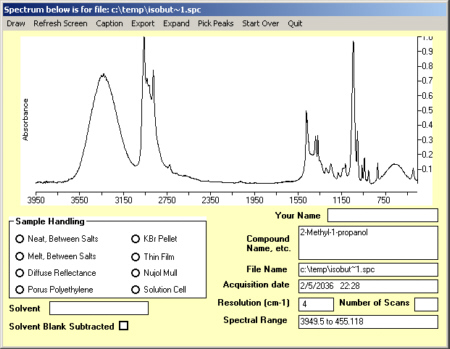
This program from Harold Bell reads Perkin Elmer, JCAMP, Spectracalc, Nicolet and CSV IR data files. It can read interferograms and processed spectra. It allows users to zoom, pick peaks, annotate, print. The advantage over the JCAMP file viewers is that it can read some spectral data in their original file format.
|
|
Reference Libraries
When students are interpreting spectra, it is very useful for them to compare spectra with known compounds. Before providing students access to these tools, spend some time thinking about what you want your students to learn. If you want them to learn spectral interpretation, you might not want them to compare their spectra with database information. If you want students to verify the identity of an unknown or the product from a synthesis, comparing experimental spectra with a library reference spectrum might be very useful. Whatever choice you make, keep in mind that it is now possible to search MS, IR, and NMR databases that include thousands of compounds. This is an extremely powerful tool for identifying unknowns and verifying chemical structures. Should our students know the strengths and limitations of these tools?
The biggest downside to spectral libraries is that they are extremely expensive. ACD/Labs and Biorad both offer an option to use online tools and pay on a per search basis. Some vendors also offer academic or student versions at significantly reduced prices. Some of these offers are only for a limited time, so be careful before adopting one of these packages. Spend some time thinking about what spectra you want in the database and how the license agreement will work for your students. Fortunately there are also several freely available spectral databases. The two most comprehensive are the NIST Webbook and the AIST Integrated Spectral Data Base System for Organic Compounds (SDBS).
|
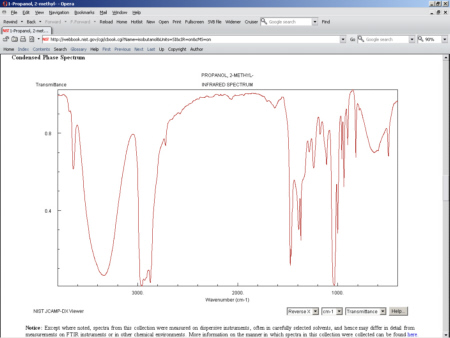
This database is provided by the National Institute of Standards and Technology. It includes over 16,000 IR spectra, 15,000 mass spectra, 1600 UV/Vis spectra and 4500 electronic and vibrational spectra. The database is searchable by formula, name, CAS registry number, reaction, author, structure, ion energetics properties, vibrational and electronic energies, and molecular weight. The spectra are available as jcamp-dx files or as images. The jcamp-dx files may be viewed online with a java enabled web browser or downloaded to view using one of the jcamp viewers listed above. The images are available to view online, scaled to print in landscape orientation, or as an SVG graphics image. The IR spectrum of isobutanol is shown below.
Image from http://webbook.nist.gov/cgi/cbook.cgi?ID=C78831&Units=SI&Mask=80#IR-Spec downloaded 8/25/2004
|
|
|
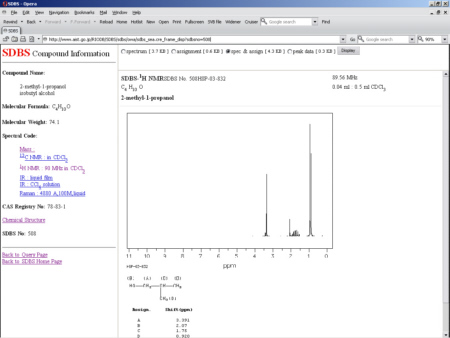
The Integrated Spectral Data Base System for Organic Compounds is provided by the Japanese National Institute for Advanced Industrional Science and Technology. The database includes 22,600 mass spectra, 14,000 H-1 NMR spectra, 12,300 C-13 NMR spectra, 49,200 IR spectra, 3500 raman spectra, and 2000 ESR spectra. The database is searchable by name, formula, molecular weight, CAS number, C-13 shift, H-1 shift, or MS peak and intensity. The spectra are available as images. Mass spectra and C-13 NMR are available as peak data. C-13 and H-1 NMR data include peak assignments.
Image from http://www.aist.go.jp/RIODB/SDBS/sdbs/owa/sdbs_sea.cre_frame_disp?sdbsno=508 downloaded 8/25/2004
|
|
NMR Processing
The data processing used for NMR is much more involved than for most other types of spectroscopy. In many organic chemistry courses all students see are carefully processed NMR data with excellent S/N, perfectly phased, with ideal integration and no solvent peaks. Many textbooks even label the carbon spectra with the number of attached protons. After seeing NMR spectra like this, many students are surprised by real data when they go to the laboratory. Getting a well phased spectrum with useful integration can require a considerable amount of time. For students to spend the time doing this, they need access NMR data processing software.
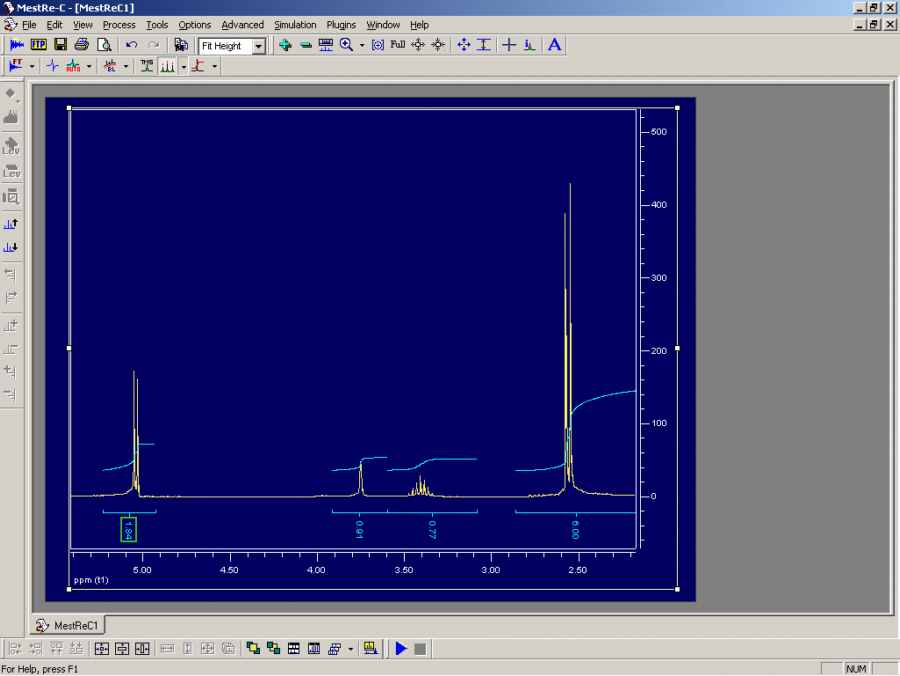
|
This is a full featured NMR data processing package. For a novice student, all the processing can be done using automated routines to phase, integrate, and pick peaks. The automatic phase, integration and peak picking routines do an excllent job processing routine data. For the expert user the program includes every processing option I have ever used with 1D and 2D NMR. The program also includes an FTP client, so that students can access data from an FTP server and it imports most spectrometer data files. Best of all it is free.
|
|
|
This program is a suite of products for processing and interpreting spectral data. Biorad has a free academic version that has many useful features. Included in the academic version is an NMR data processing package. It is not as full featured as MESTRE-C or the commercial packages described below. It includes automated routines that beginners will find very useful, but it does not include more advanced features that advanced users will need. It will import data from a variety of spectrometers, but the list is not as long as for Nuts or MESTRE-C. One of the nicest features of this software is that it is designed as a suite of applications so students can easily add structures and annotate their spectra when writing reports.
|

|
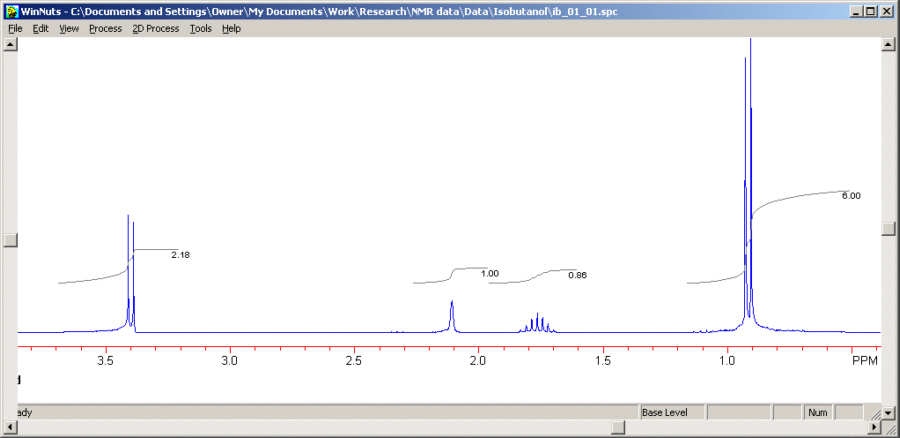
|
This is a full featured NMR data processing package. It includes all processing techniqes and can import data from almost any spectrometer. It includes robust automatic processing routines for beginners. It is easy to program macros to further automate processing. It will do anything that an expert user needs for processing data. It includes a command line interface that makes processing very fast if you know the two letter commands (very similar to processing on an older Bruker instrument). It is available in several different versions including: a 30 day trial version, a lite version for routine 1D processing, a full version, a 2D version, and an array processing version.
|
|
|
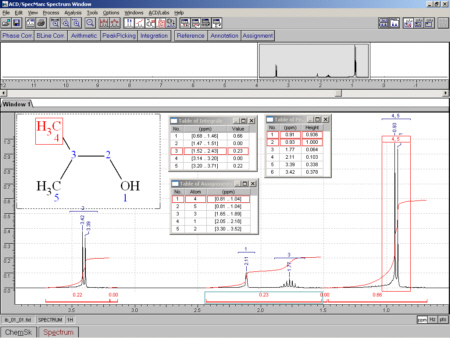
. This program is part of a full featured suite of data processing and analysis packages. The NMR data processing package is full featured and very easy to use. Since it is part of a software suite it is easy to add chemical structures, annotate spectra, and create reports. Other parts of the software suite will calculate chemical shifts, search spectral libraries, and can even elucidate the structure of an unknown from the spectral data. Advanced Chemistry Development, Inc. (ACD/Labs) used to have a free spectral viewer, but that product has been discontinued. The one downside to this software is that it is very expensive.
|
|
Interpretation
If money is not a consideration, there are some fantastic software packages to help users go from raw spectral data to a fully interpreted structure. ACD/Labs, Biorad, Bruker, and ThermoGalactic have great software for predicting NMR chemical shifts, correlating IR spectra, predicting MS fragmentation, and searching spectral databases. The problem with these programs is that they are usually VERY expensive. It is worthwhile to watch for special academic or student versions of these programs. They often have lots of useful features at a much lower price. Below are some free software packages that students will find useful when interpreting spectra.
|
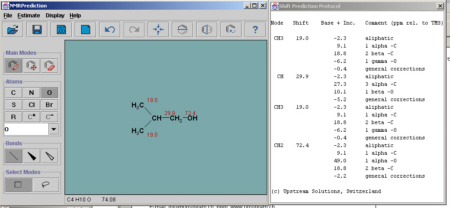
When I found this chemical shift prediction program, I realized that it was time for me to completely change the way I teach NMR shift calculations. For years, I have been using a chapter on chemical shifts from the "Encyclopedia of Analytical Chemistry". Students use tables and formulas to calculate chemical shifts for proposed structures. This takes a considerable amount of time, but students learn about how structure determines the NMR spectrum. With this free program, students can draw a proposed structure and calculate the proton and carbon shifts. The program will even show how the chemical shift is calculated. The prediction routine is not as sophisticated or accurate as those used by more expensive commercial applicaitons but it is equivilent to the calculations done by my students. With a tool this useful freely available for students, it is difficult to justify calculating shifts by hand or using correlation tables. This program will also generate a coordinate file for the 3D structure and save it in MDL or MOL file format.
|
|
|
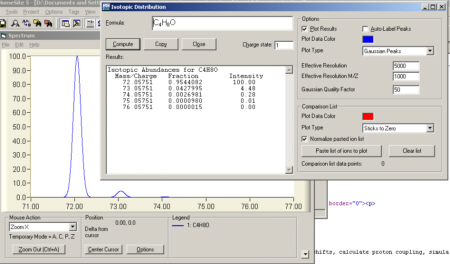
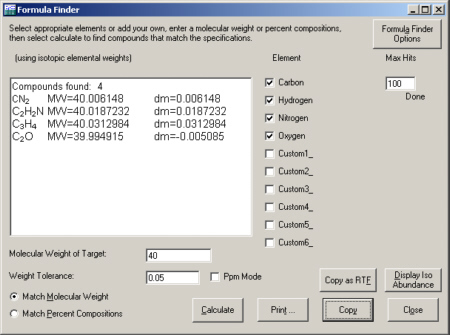
This free program by Matthew Monroe is very useful for interpreting mass spectra. The program has lots of tools for chemical calculations, but two are of particular interest for interpreting spectra. The first is an isotope distribution calculateor. The user enters a chemical formula and the program calculates isotope distributions that are observed in a mass spectrum. The second tool is a routine that calculates molecular formulas to match a given mass. This will help students determine the possible composition of different ions and with high resolution data students can unambiguously assign the chemical formula for an ion.
|
|
|
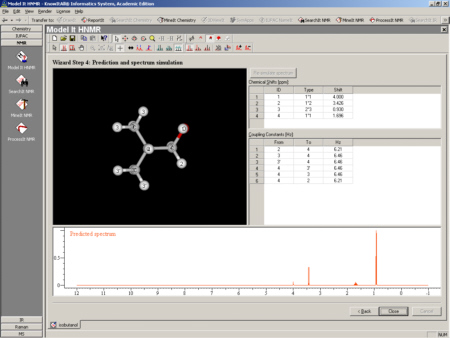
In addition to the data processing discussed above, the academic version of this software includes a number of useful tools for spectral interpretation. The program will calculate proton chemical shifts and coupling constants for a structure. This information is then used to calculate a simulated spectrum. The academic version does not do C-13 shift calculations, but this is a great tool for learning NMR and for verifying a proposed structure.
|
|
| |
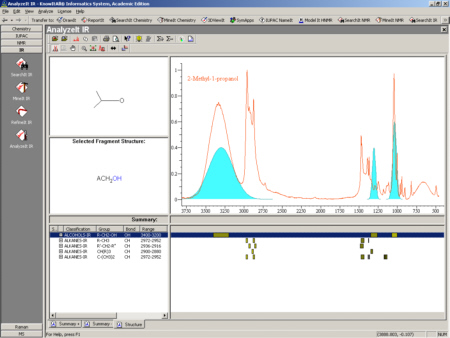
KnowItAll also includes a tool for analyzing IR data. With this tool, you open an IR spectrum and a chemical structure. When a functional group is selected in the chemical structure, the program overlays the correlation bands with the experimental IR data. This is a very visual way to interpret an infrared spectrum and test it against a proposed structure. An example of how this looks is shown in the figure below. This should be very useful for students as they learn how to interpret Infrared data.
|
|
Conclusion
I know there are lots of other excellent programs out there. I hope that this paper has provided some ideas about what is possible. The other comment that I want to close with is that the most important thing to do is to think about what you want your students to learn. If you can determine this, it is easy to find the right software tools. If you can find freeware to distribute to your students on a CD-ROM, it will make things much easier for them. Although students are now much more comfortable with computers than the were even five years ago, downloading and installing software is a significant barrier for many students. At the other end of the spectrum, you should be aware of what is now possible using free software tools. If you think that all your students are still interpreting spectra by hand, you may be in for a surprize. These tools provide an opportunity to change how we teach and what our students can learn.
Finally, I would like to thank all the software developers for the time and effort they put into their products.
This page is maintained by
Scott Van Bramer
Department of Chemistry
Widener University
Chester, PA 19013
Please send any comments, corrections, or suggestions to
svanbram@science.widener.edu.
This page has been accessed
times since 1/5 /96 .
Last Updated 8/27/2004