There are several different ways that images may be used with web pages. Most browsers can view two different types of graphics files. The GIF (Graphical Image Format) file format works best for line art and small images. This file type preserves sharp lines and gets excellent compression when there are large spaces with the same color. The gif image below is inserted with the following HTML code:
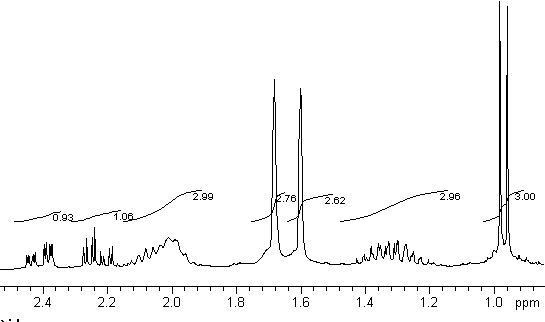
<IMG SRC="h_int_d.gif" ALT="Proton NMR Spectrum of citronellal" WIDTH=545 HEIGHT=322>
Notice that the HTML code specifies the width and height of the image. This allows the browser to format the rest of the web page while the image downloads. If the image size is not specified the browser must wait to render the rest of the document. The ALT command in the tag specifies text to displayed until the graphic downloads. It is also important for readers with limited vision who rely upon a text to voice program to hear a web page.
The JPEG (Joint Photographic Experts Group) file format works best for photographs and color images. Some resolution is lost for line art (lines are not as crisp) but file size for photographs is dramatically reduced. This compression works by using shades of color to reduce the file size.
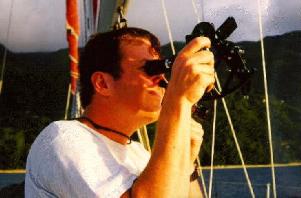
<IMG SRC="sey98h.jpg" ALT="Taking a sextant reading " WIDTH=301 HEIGHT=198>
Because images files can be large, spend some time editing the graphic so that it is as small as practical and use as much compression as you can. If you really need to use a high resolution image it is good form to include a thumbnail in the web page. This small image is a link to the full size image. Interested readers can then download the high resolution figure.
This is an extremely useful feature for teaching. Images can be used for links. By using an image map, it is possible to specify different links to different parts of an image. One example for how this could be used is a web page where selecting a different section of an NMR spectrum brings up a discussion of that peak. There are lots of possibilities to how this could be used.
The first step is to find an image and then map out the areas of interest. The maps are created by pixel in the image. Some web page creation software includes features to help with this. Doing it by hand is VERY tedious. An example of an image map is given below.
|
<map name="isobutanol"> <area alt="3.4 ppm doublet" coords="12,125,59,257" href="3_4_ppm.html"> <area alt="2.6 ppm singlet" coords="169,170,218,254" href="2_6_ppm.html"> <area alt="1.7 ppm multiplet" coords="332,211,379,253" href="1_7_ppm.html"> <area alt="1.7 ppm multiplet zoom" shape="circle" coords="346,125,71" href="1_7_ppm_zoom.html"> <area alt="0.9 ppm doublet" shape="poly" coords="506,254,541,254,540,5,504,3,497,188" href="0_9_ppm.html"> <area alt="isobutanol proton NMR" shape="default" href="imagemap1.html"> </map> <img src="ib_01_0a.jpg" width="559" height="300" border="0" usemap="#isobutanol"> |
Please send any comments, corrections, or suggestions to svanbram@science.widener.edu.
This page has been accessed
times since 1/1/97.
Last Updated 1/1/97